How to Add a pie chart in Excel.
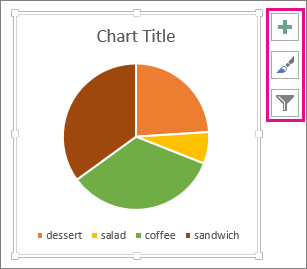
- In your spread-sheet, select information to use for your any chart.For more information on how pie chart data should be organized, see Pie chart data.Click Insert> Insert Pie or Donut Chart, and select the chart you want.Pie chart option in the charts group on the Insert tabClick the chart and click the icons next to the chart to add a finishing touch:To display, hide, or formatting items such as axis titles or data labels, click the Chart Elements button.To quickly change the color or style of a chart, use Chart Styles Customize the look of your chart.To view or hide the data in your chart click on the chart filter filter button.Pie chart with Chart buttons, Chart Styles, and Chart Filter Buttons

Download Assignments


No comments:
Post a Comment